Recharging and refuelling stations map
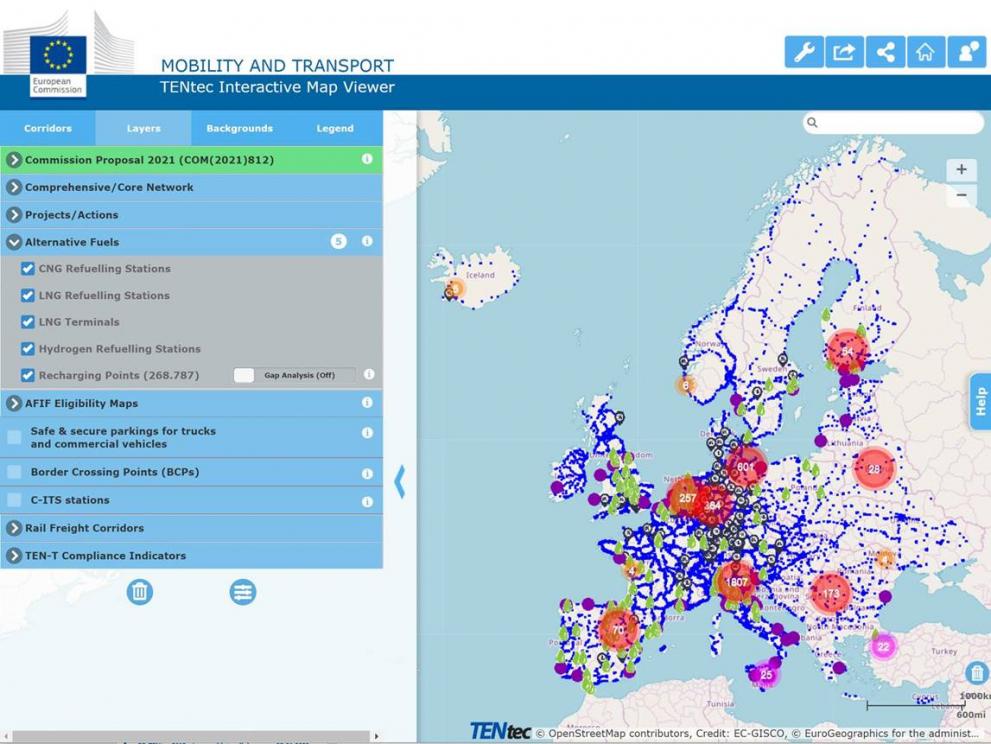
TENtec interactive map
TENtec is the European Commission’s Information System to coordinate and support the Trans-European Transport Network Policy (TEN-T). It focuses on policy-related information by storing and managing technical, geographical and financial data for the analysis, assessment and political decision-making related to TEN-T and the underlying funding programme, the Connecting Europe Facility (CEF).
The TENtec Geographic Information System displays the core and comprehensive TEN-T network, as well as related transport infrastructure information, on an interactive map. With the support of EAFO, this interactive map now contains a comprehensive and up-to-date overview of the alternative fuels infrastructure deployed in the EU and neighbouring countries. It also contains a basic gap analysis, which allows the identification of gaps in the alternative fuels infrastructure coverage on the TEN-T network. In the future, it will allow an even more sophisticated data analysis, to superimpose alternative fuels infrastructure on different thematic layers such as traffic flows, population density, air quality etc.
1. EU alternative fuels fleet
The reference year and month for the graphs and maps in this section is the same as for road transport country reports.
1.1 Absolute numbers
This sub-section shows the total alternative fuels (AF) fleet numbers in the EU Member States in the reference year, and, where such data is available, compares these against the total vehicle fleet numbers in those Member States.
AF passenger cars and vans
Fleet of alternative fuels (BEV, PHEV, H2, LPG, CNG, LNG) passenger cars and vans (M1+N1)
AF passenger cars and vans
Percentage of the total passenger cars and vans fleet (M1+N1) that is powered by alternative fuels (BEV, PHEV, H2, LPG, CNG, LNG)
AF buses
Fleet of alternative fuels (BEV, PHEV, H2, LPG, CNG, LNG) buses (M2 + M3)
AF trucks
Fleet of alternative fuels (BEV, PHEV, H2, LPG, CNG, LNG) trucks (N2 + N3)
BEV passenger cars and vans
Fleet of battery-electric (BEV) passenger cars and vans (M1+N1)
BEV% passenger cars and vans
Percentage of the total passenger cars and vans fleet (M1+N1) that is full battery-electric (BEV)
PHEV passenger cars and vans
Fleet of plug-in hybrid electric (PHEV) passenger cars and vans (M1+N1)
PHEV% passenger cars and vans
Percentage of the total passenger cars and vans fleet (M1+N1) that is plug-in hybrid electric (PHEV)
H2 passenger cars and vans
Fleet of hydrogen (H2) passenger cars and vans (M1+N1)
H2% passenger cars and vans
Percentage of the total passenger cars and vans fleet (M1+N1) that is powered by hydrogen (H2)
1.2 Growth rates (2021 vs. 2020)
This sub-section compares alternative fuels fleet numbers in the reference year 2021, to alternative fuels fleet numbers in the preceding year 2020, and, where such data is available, compares these alternative fuels fleet growth rates against the overall growth rates of vehicles in the same vehicle categories.
Growth rate AF passenger cars and vans
Year-over-year growth rate of the alternative fuels (BEV, PHEV, H2, LPG, CNG, LNG) passenger cars and vans (M1+N1) fleet.
Growth rate AF buses
Year-over-year fleet growth rate of the alternative fuels (BEV, PHEV, H2, LPG, CNG, LNG) buses (M2+M3) fleet.
Growth rate AF trucks
Year-over-year growth rate of the alternative fuels (BEV, PHEV, H2, LPG, CNG, LNG) truck (N2+N3) fleet.
Growth rate BEV passenger cars and vans
Year-over-year growth rate of the BEV passenger cars and vans (M1+N1) fleet.
Growth rate BEV buses
Year-over-year growth rate of the BEV buses (M2+M3) fleet.
Growth rate BEV trucks
Year-over-year growth rate of the BEV trucks (N2+N3) fleet.
Growth rate PHEV passenger cars and vans
Year-over-year growth rate of the PHEV passenger cars and vans (M1+N1) fleet.
Growth rate PHEV buses
Year-over-year growth rate of the PHEV buses (M2+M3) fleet.
Growth rate PHEV trucks
Year-over-year growth rate of the PHEV trucks (N2+N3) fleet.
Growth rate H2 passenger cars and vans
Year-over-year growth rate of the hydrogen (H2) passenger cars and vans (M1+N1) fleet.
Growth rate H2 buses
Year-over-year growth rate of the hydrogen (H2) buses (M2+M3) fleet.
Growth rate H2 trucks
Year-over-year growth rate of the hydrogen (H2) trucks (N2+N3) fleet.
2. EU alternative fuels registrations
2.1 Absolute numbers
This sub-section shows the new registrations of alternative fuels vehicles in the Member States, and, where such data is available, compares these against the total numbers of new registrations in the same vehicle categories in those Member States.
AF passenger cars and vans
New registrations of alternative fuels (BEV, PHEV, H2, LPG, CNG, LNG) passenger cars and vans (M1 + N1)
Market share AF passenger cars and vans
Percentage of the total new passenger cars and vans (M1 + N1) registrations that is powered by alternative fuels (BEV, PHEV, H2, LPG, CNG, LNG)
AF buses
New registrations of alternative fuels (BEV, PHEV, H2, LPG, CNG, LNG) buses (M2 + M3)
AF trucks
New registrations of alternative fuels (BEV, PHEV, H2, LPG, CNG, LNG) trucks (N2 + N3)
BEV passenger cars and vans
New registrations of battery electric passenger cars and vans (M1+N1)
Market share BEV passenger cars and vans
Percentage of the total new passenger cars and vans (M1 + N1) registrations that is full battery electric (BEV)
PHEV passenger cars and vans
New registrations of plug-in hybrid electric (PHEV) passenger cars and vans (M1+N1)
Market share PHEV passenger cars and vans
Percentage of the total new passenger cars and vans (M1 + N1) registrations that is plug-in hybrid electric (PHEV)
H2 passenger cars and vans
New registrations of hydrogen (H2) passenger cars and vans (M1+N1).
Market share H2 passenger cars and vans
Percentage of the total new passenger cars and vans (M1 + N1) registrations that is powered by hydrogen (H2)
3. EU alternative fuels infrastructure
The reference year for the graphs and maps in this section is the same as for road transport country reports. For growth rates, 2021 to 2020 figures are displayed, until data for 2022 is completely available.
3.1 Electricity
This sub-section provides an overview of the publicly accessible recharging points installed in the Member States, their growth rates (year-over-year, between the reference year and the preceding year) and their total power output.
Recharging points
Total number of publicly accessible recharging points.
Growth rate of recharging points
Year-over-year (2021 vs. 2020) growth rate of publicly accessible recharging points.
AC recharging points
Total number of publicly accessible AC recharging points.
Growth rate of AC recharging points
Year-over-year (2021 vs. 2020) growth rate of publicly accessible AC recharging points.
DC recharging stations
Total number of publicly accessible DC recharging points.
Growth rate of DC recharging points
Year-over-year (2021 vs. 2020) growth rate of publicly accessible DC recharging points (EVSE)
3.2 Hydrogen (H2)
This sub-section provides an overview of the publicly accessible hydrogen refuelling points installed in the Member States, their growth rates (year-over-year, between the reference year and the preceding year) and their relative numbers compared to the registered amount of hydrogen vehicles.
H2 refuelling points
Total number of hydrogen (H2) refuelling points
Growth rate of H2 refuelling points
Year-over-year (2021 vs. 2020) growth rate of hydrogen (H2) refuelling points.
H2 vehicles per H2 refuelling point
Number of hydrogen (H2) vehicles per hydrogen refuelling point (high and low pressure).
3.3 Natural gas
This sub-section provides an overview of the publicly accessible natural gas (CNG and LNG) refuelling points installed in the Member States, their growth rates (year-over-year, between the reference year and the preceding year) and their relative numbers compared to the registered amount of natural gas vehicles.
CNG refuelling points
Total number of CNG refuelling points
Growth rate of CNG refuelling points
Year-over-year (2021 vs. 2020) growth rate of CNG refuelling points.
CNG vehicles per CNG refuelling point
Number of CNG vehicles per CNG refuelling point.
LNG refuelling points
Total number of LNG refuelling points
Growth rate of LNG refuelling points
Year-over-year (2021 vs. 2020) growth rate of LNG refuelling points.
LNG vehicles per LNG refuelling point
Number of LNG vehicles per LNG refuelling point
3.4 LPG
This sub-section provides an overview of the publicly accessible LPG refuelling points installed in the Member States, their growth rates (year-over-year, between the reference year and the preceding year) and their relative numbers compared to the registered amount of LPG vehicles.
LPG refuelling points
Total number of LPG refuelling points
Growth rate of LPG refuelling points
Year-over-year (2021 vs. 2020) growth rate of LPG refuelling points.
LPG vehicles per LPG refuelling point
Number of LPG vehicles per LPG refuelling point.